RESEARCH AREAS
Stratigraphic architecture of the Tuscan Formation
The very same sheets of volcanic fragmented rocks, called the Tuscan Formation, which are exposed in Upper Bidwell Park dive under the town of Chico and serve as the city’s main groundwater supply. Despite the paucity of data on how the aquifer works and its recharge mechanism, overly optimistic forecasts believe the upper and lower portions of the Tuscan Formation will continue to supply water resources to the region with excess water to send elsewhere. Pump tests have been conducted in the lower portion of the Tuscan Formation which has even fewer data available (relative to the upper portion) regarding its storage and flow capacity.
My students and I are conducting studies that focus on the outcrop stratigraphy and sedimentology of the Tuscan Formation. We map the geometry of internal Tuscan surfaces and document the sedimentary fill of Tuscan deposits. The results provide a geologic framework for the Tuscan in outcrop and provide others with tools to correlate between outcrops and into the subsurface. If the Tuscan can be better understood in the subsurface, then more realistic groundwater models will better constrain the flowpaths and storage volumes of Butte County’s water supply.
My students and I are conducting studies that focus on the outcrop stratigraphy and sedimentology of the Tuscan Formation. We map the geometry of internal Tuscan surfaces and document the sedimentary fill of Tuscan deposits. The results provide a geologic framework for the Tuscan in outcrop and provide others with tools to correlate between outcrops and into the subsurface. If the Tuscan can be better understood in the subsurface, then more realistic groundwater models will better constrain the flowpaths and storage volumes of Butte County’s water supply.
Beyond DWR publications, surprisingly little on Tuscan stratigraphy has been published since 1968. A handful of Chico State Masters theses and posters presented at geology conferences have served as excellent references, but they have not been published in peer-reviewed journals and they have not been assimilated into a unified framework. Fundamental questions still linger about what types of flows deposited Tuscan rocks (rivers vs. volcanic flows vs. mudflows) and the topographic expression before Tuscan sediments were deposited.
Beyond DWR publications, surprisingly little on Tuscan stratigraphy has been published since 1968. A handful of Chico State Masters theses and posters presented at geology conferences have served as excellent references, but they have not been published in peer-reviewed journals and they have not been assimilated into a unified framework. Fundamental questions still linger about what types of flows deposited Tuscan rocks (rivers vs. volcanic flows vs. mudflows) and the topographic expression before Tuscan sediments were deposited.
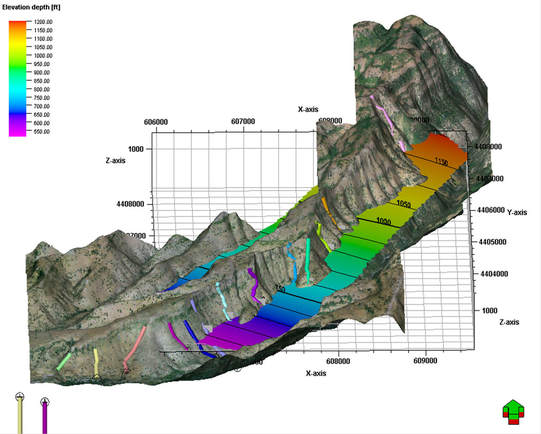
DEM on the northside of Big Chico Creek Canyon showing stratigraphic sections (colored bars) and structure map of a time-correlative surface through the Tuscan Formation (from Masters Thesis of Marisol Gonzalez, 2014).
We are also developing a better understanding the fluvial architecture of the Pliocene-aged Lower Tuscan by developing a regionally consistent hydrostratigraphy that can serve as the foundation for groundwater models used to predict well water drawdrown effects from pumping within the Lower Tuscan. Although there are no known regional time-stratigraphic surfaces, exploiting provenance differences in Coast Ranges-sourced sediment (metamorphic) from Cascades-sourced sediment (volcanic) can help delineate time-equivalent packages within the fluvial-dominated Tuscan and Tehama formations. Using geophysical logs from over 450 wells as well as point-count data from sandy portions of well cuttings samples from different wells, regionally mappable zones spanning an area approximately 440 square miles identify key areas where high percentages of porous sand (i.e. water-rich zones) exist within the Lower Tuscan. The underlying objective is to provide a more realistic geologic model for groundwater flow simulators to use so reasonable assessments on water volumes and flowpaths can help dictate regional water policy for the foreseeable future. If more is understood about the Tuscan aquifer system, then the decision to pump large volumes of water out of the lower Tuscan to southern California may be curtailed to a point where local economies can prepare.
|
My graduate students are creating a geologic framework for the Tuscan Formation in outcrop which can then be transferred to the subsurface. Basic field mapping characterize: 1) the paleo-topography during various stages of Tuscan deposition, 2) the range of depositional facies and flow types that deposited Tuscan rocks, and 3) vertical trends in composition of mud, sand, and conglomerate. Students also petrographically characterize the top of the Tuscan Formation from drilling core in order to differentiate the Tuscan aquifer for the overlying younger water-bearing units which can then be mapped using wireline logs underneath the town of Chico. 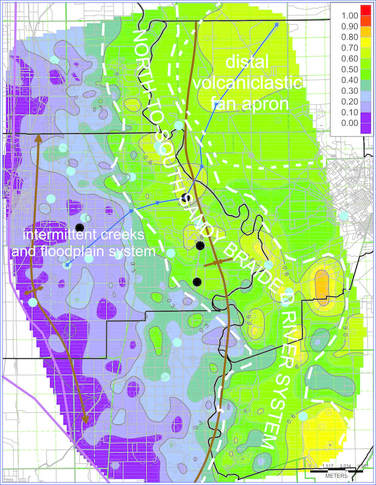
The map shows the fraction of water-bearing sands within the main lower Tuscan/Tehama formation interval. The colors span values from 0 to 1; 1 = 100% water-bearing sands, and 0 = 0% water-bearing sands). Note the general meandering river-like pattern of the high proportion of water-bearing sands (warm colors) in the eastern area. This pattern has a sharp boundary against the area with lower proportions of water-bearing sands (cold colors) in the western portion of the study area. The white lines and text represent the interpretation for how the original sands and muds were deposited approximately two to three million years ago in the northern Sacramento Valley.
|
I also conducted work on the subsurface Lower Tuscan/Tehama aquifer through analysis and digitization of nearly 120 wells in the area to help calibrate the AEM (Airborne Electromagnetic Method) data collected as part of a multi-organizational project (The Groundwater Aquifer Project, GAP) that included Stanford University, Butte County, Department of Water Resources and the Danish Environmental Protection Agency. My work was used to by others to create a 3-D electrical resistivity model of the Tuscan/Tehama aquifer near Chico. Using the AEM data, I created a new stratigraphic nomenclature for the Tuscan-Tehama aquifer in the area of the AEM acquisition. This was used in the Groundwater Sustainability Plan (GSP) submitted by the Vina sub-basin Groundwater Sustainability Agency (GSA) in 2021 within the framework of the Sustainable Groundwater Management Act (SGMA).
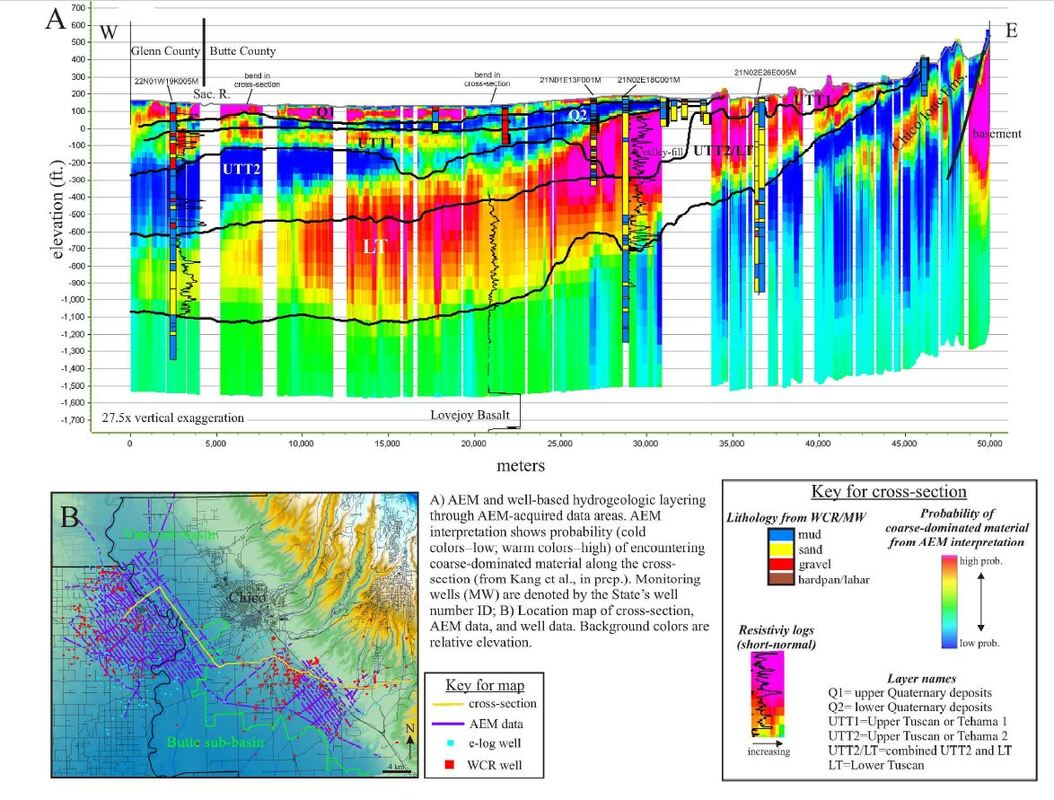
This also lead to a 2021 publication with Stanford, Butte County, and UC Davis workers on using AEM data to help define connectivity within the aquifer system.
Kang, S., Knight, R., Greene, T.J., Buck, C., and Fogg, G., 2021, Exploring the Model Space of Airborne Electromagnetic Data to Delineate Large-Scale Structure and Heterogeneity Within an Aquifer System: Water Resources Research, v. 57, e2021WR029699. https://doi.org/10.1029/2021WR029699.r-2b-kang_et_al_2021.pdf
Kang, S., Knight, R., Greene, T.J., Buck, C., and Fogg, G., 2021, Exploring the Model Space of Airborne Electromagnetic Data to Delineate Large-Scale Structure and Heterogeneity Within an Aquifer System: Water Resources Research, v. 57, e2021WR029699. https://doi.org/10.1029/2021WR029699.r-2b-kang_et_al_2021.pdf
Deep-water deposits at San Luis Reservoir
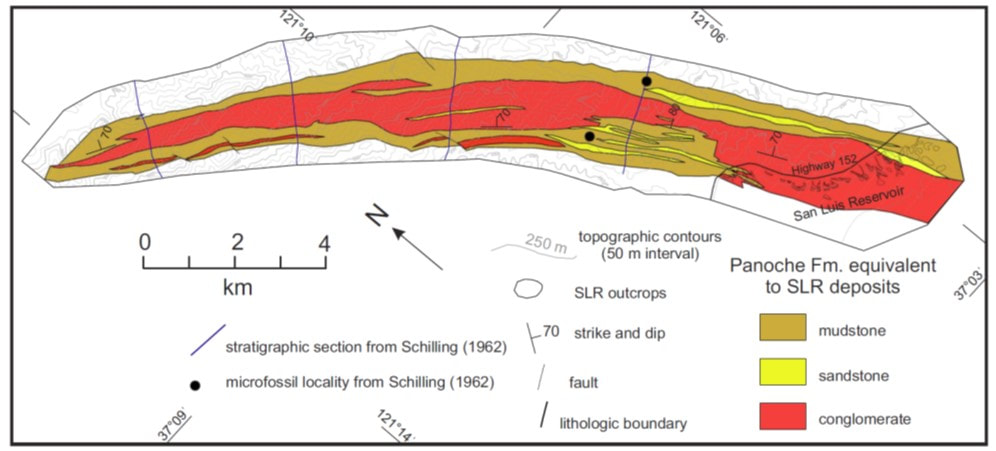
The San Luis Reservoir in central California covers a faulted contact (Ortigalita Fault) between the Franciscan rocks to the west and the Great Valley Group (GVG) rocks to the east. The best pre-reservoir geologic map of the area derives from Schilling’s (1962) unpublished dissertation. Schilling documented up to 1.2 km thick of conglomerate in the Panoche Formation (Cenomanian) of the Upper Cretaceous GVG across 22 km of GVG strike ridges. I focused on the ~100-million-year-old rocks exposed on the perimeter of the San Luis Reservoir. These rocks have received very little attention in the geologic literature yet are well-exposed when water levels are low in the San Luis Reservoir. My work involved collaboration with Dr. Kathleen Surpless at Trinity University (San Antonio, TX), multiple field seasons collecting data, computer work, laboratory work, and dissemination of results. Dissemination of results include publication in Geosphere, two College of Natural Sciences Poster Session posters (with 5 undergraduate student co-authors, invited talks at GEOS seminar series, Trinity University, Stanford University, and University of the Pacific, and a field trip for Stanford University’s SPODDS (Stanford Project on Deep-water Depositional Systems) group.
Greene, T.J., and Surpless, K.D., 2017, Facies architecture and provenance of a boulder-conglomerate submarine channel system, Panoche Formation, Great Valley Group: A forearc basin response to middle Cretaceous tectonism in the California convergent margin: Geosphere, v. 13, p. 838 – 869, doi:10.1130/GES01422.1.
Greene, T.J., and Surpless, K.D., 2017, Facies architecture and provenance of a boulder-conglomerate submarine channel system, Panoche Formation, Great Valley Group: A forearc basin response to middle Cretaceous tectonism in the California convergent margin: Geosphere, v. 13, p. 838 – 869, doi:10.1130/GES01422.1.
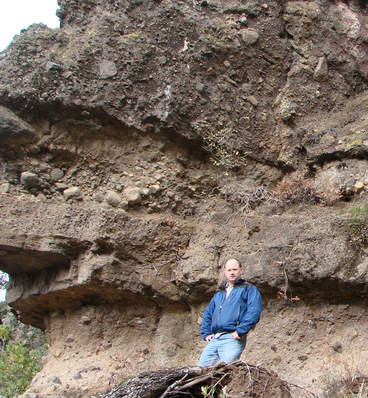
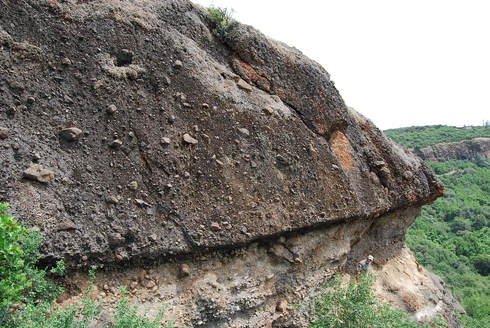
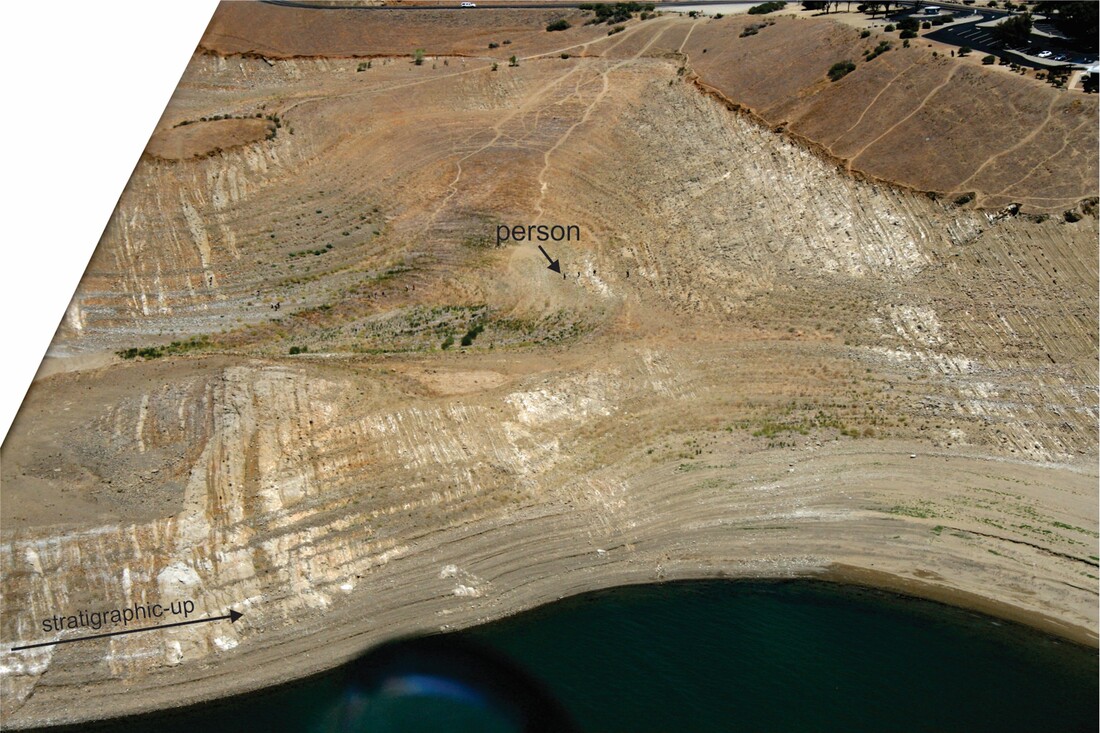
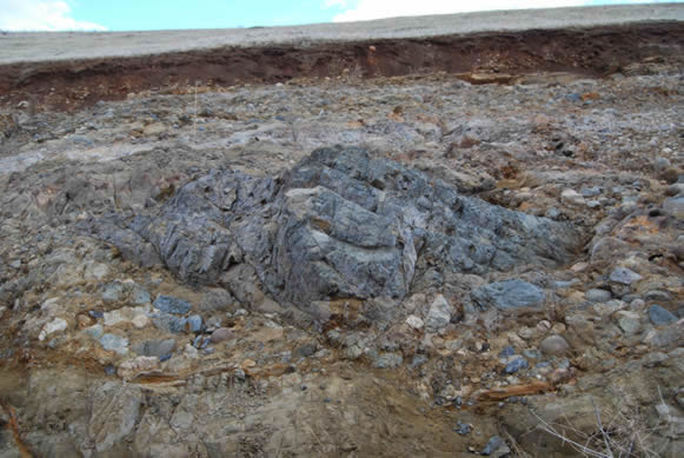
Based on numerous publications of GVG deep-water outcrops and the summary publication by Lowe (2004) on GVG deep-water depositional systems, the section at San Luis Reservoir represents the thickest exposure of GVG coarse (cobble to boulder) deep-water deposits documented with the possible exception of the Center Peak Conglomerate (~500 m thick) west of Coalinga. Since 1962, however, very little, if any work has been conducted on the San Luis Reservoir outcrop. Depositional environments are interpreted to be similar to those reported for the Juniper Ridge Conglomerate to the south near Coalinga (Lowe, 2004). Namely, the section represents large incised conglomerate-filled channels that could either lie within a proximal fan position or within a submarine canyon. The photo below is an aeriel view showing deep incision within a ~200 meter long section (stratigraphic-up is to the right).
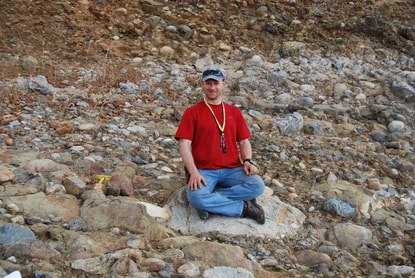
At the reservoir site, a 1.8 km thick section of mostly boulder conglomerate (I'm sitting on on a typical granitic boulder in the photo above) deep-water channelized deposits of the Great Valley forearc system is beautifully exposed.
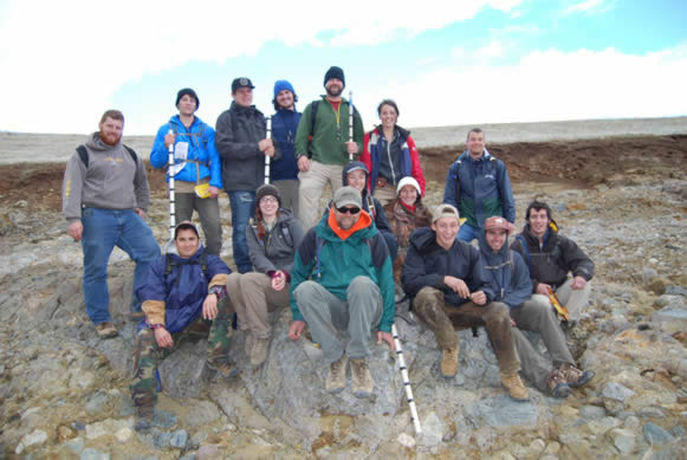
Another 4-meter long clast is so big, I had the entire senior class of geology majors pose as scale! Yes, everyone is standing or sitting on the mega-clast!
With geology majors...
With geology majors...
Without geology majors...
Eel River Basin
Featureless, massive beds could be caused by 1) suspension fall-out of concentrated sands within a turbiditic flow, 2) post- or syn-depositional liquefaction, or 3) obliteration of original sedimentary fabric by bioturbation. Although massive beds are a common element of high- and low-density turbidites, they can also occur in densely bioturbated slope deposits. It is therefore important to accurately interpret massive sandy beds in deep-water successions in order to create reliable depositional/reservoir models.
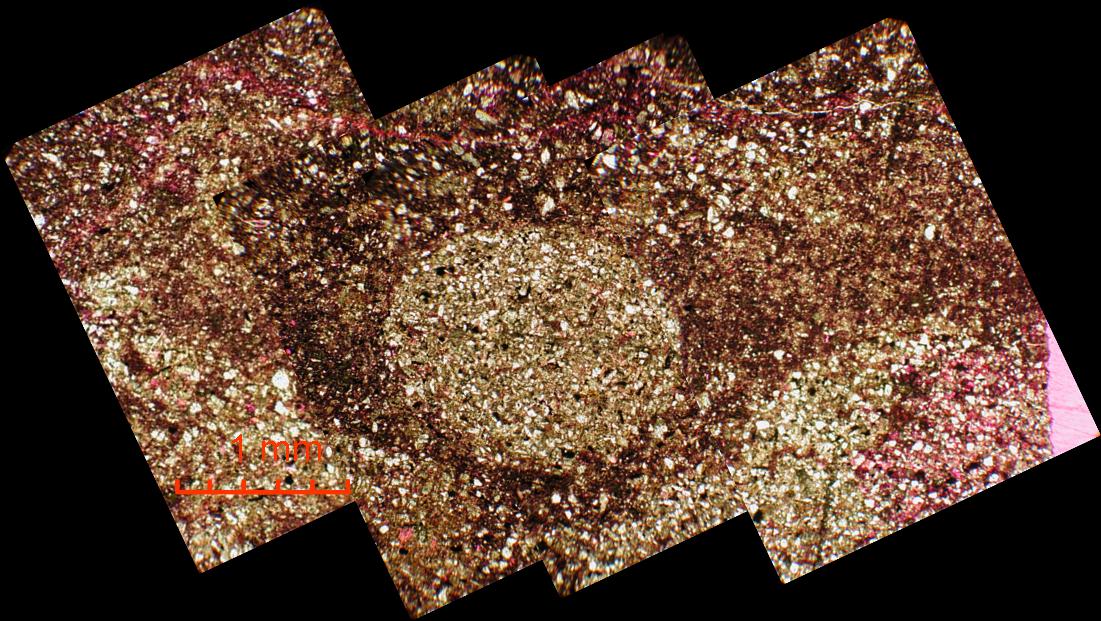
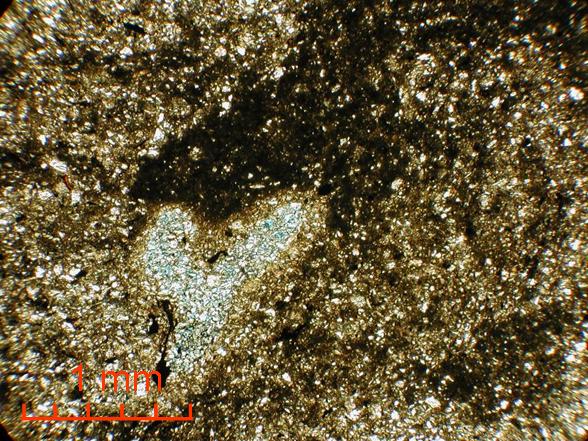
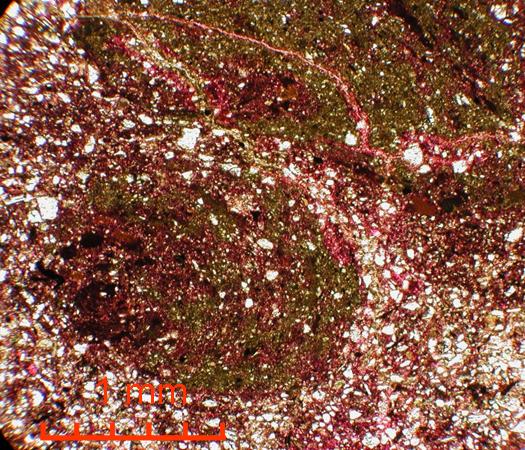
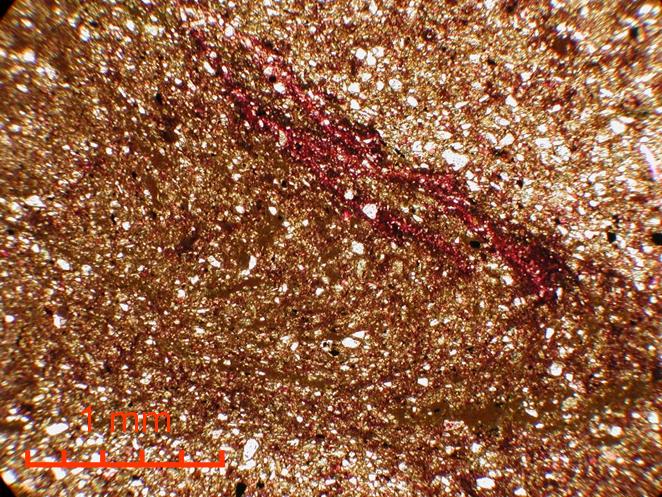
A case study in the Pliocene Rio Dell Formation demonstrates the need for a multi-faceted approach to understand the origin of massive beds. The onshore Eel River basin in California contains over 3,000 feet of mud-rich bathyal deposits with discrete deep-water sand packages up to 150 feet thick (20-40% net sand). Cores that contain sand/mud pairs were previously interpreted as “linked-debrites” consisting of a lower sandy turbidite linked with an overlying muddy debrite. However, computer-aided tomography (CT) x-ray scans, combined with petrography and SEM data, suggests each sand/mud pair records multiple episodes of bioturbation.
Seismic studies
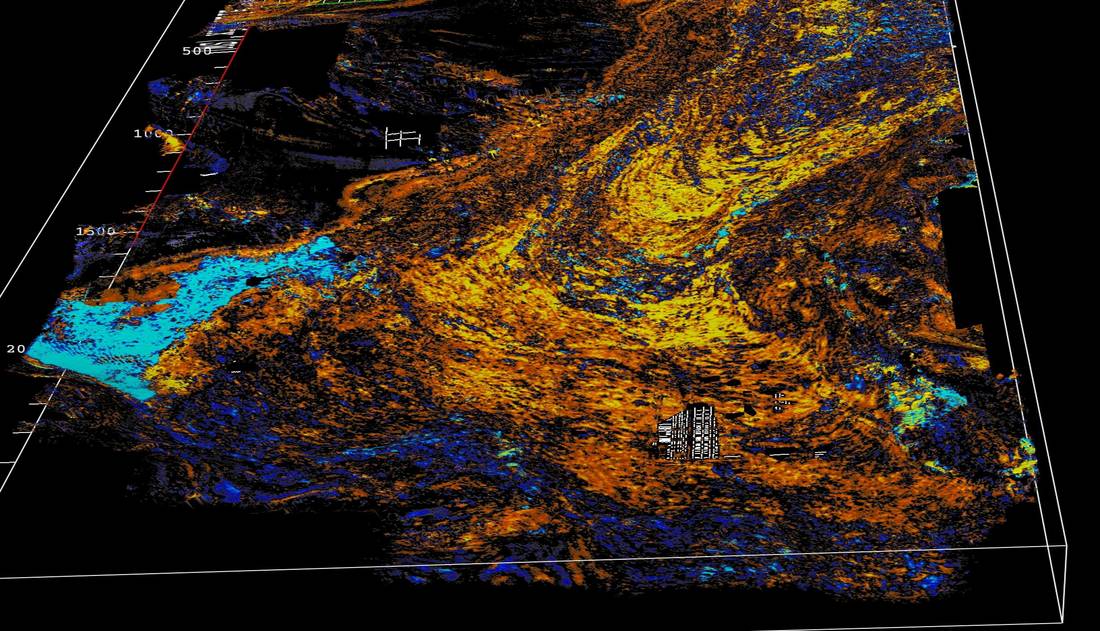
Slice through one of the MTCs in the 3-D seismic dataset showing MTC seismic pattern in a perspective mapview. Different lobes of the MTC are highlighted as well as the boundaries. (The MTC has traveled from top to bottom).
The Tectonics and Sedimentation Lab houses a seismic workstation ready and loaded with a 3-D seismic dataset from the western Gulf of Mexico (courtesy of Anadarko Petroleum Corporation). I am currently working with a graduate student to test whether a relationship exists between seismic facies of deep-water Mass Transport Complexes (MTCs) and pre-MTC emplacement conditions. Specifically, we propose to correlate seismic facies distribution to the following testable initial conditions: 1) proximity to source, 2) degree of bathymetric confinement, 3) slope, and 4) roughness of the seafloor. If research objectives are met, the results could be used to better predict facies in areas that contain MTCs as seals, traps, or possible reservoirs. Additionally, our study could stimulate research of analogous datasets by providing a novel approach that establishes a genetic linkage between the MTC deposit and its boundary conditions.
MTCs are an important component to deep-water depositional systems, yet little is known about their internal structure at the field scale (1-100 km2). Recently, industry’s willingness to part with shallow portions of high-resolution 3-D seismic datasets has given researchers valuable insight into deep-water processes, and to fill the data gap between outcrop studies and lower resolution seismic data.
MTCs are an important component to deep-water depositional systems, yet little is known about their internal structure at the field scale (1-100 km2). Recently, industry’s willingness to part with shallow portions of high-resolution 3-D seismic datasets has given researchers valuable insight into deep-water processes, and to fill the data gap between outcrop studies and lower resolution seismic data.
